June 2026 Home Sales Statistics from the Lawrence MLS
Detailed 22-page report for the City of Lawrence - June 2026
Detailed 22-page report for Douglas County - June 2026
See the Current Press Release, 3 Year Comparison, and Report Archives below.
July 10, 2026
Lawrence Board of REALTORS® Releases Home Sales Figures for June 2026
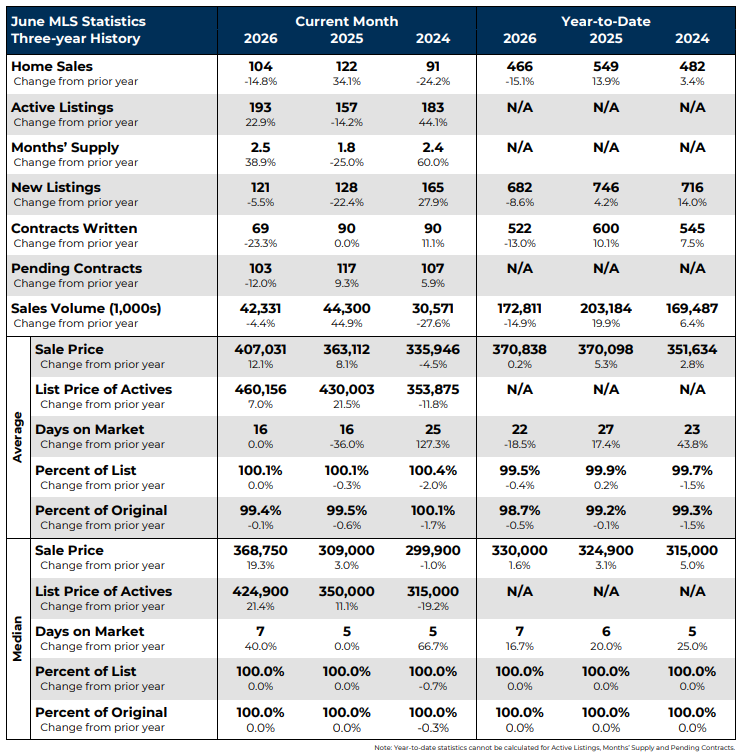
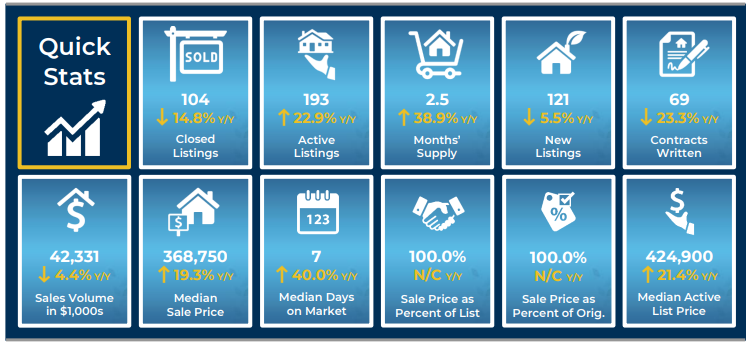
Homes sales in the City of Lawrence fell by 14.8% in June compared to the prior year. Sales in June 2026 totaled 104 units, down from 122 in 2025.
Among existing homes, 103 units sold in June, a decrease of 8.8% from 113 units that sold in 2025. The average sale price of existing homes was $406,623. This represents an increase of 11.8% from the June 2025 average price of $363,644.
For new construction, 1 sales occurred in June, down from 2 units the prior year, a decrease of 50.0%. The average sale price of new homes in June was $449,000, down 7.9% from the same period last year.
A total of 69 contracts for sale were written in June 2026, down from 90 in June 2025. This is a decrease of 23.3%. Contracts written during the month reflect, in part, sales that will close in the near future.
The inventory of active listings in the City of Lawrence stood at 193 units at the end of June, which is up from 157 homes that were on the market at the end of June last year. At the current rate of sales, this figure represents 2.5 months' supply of homes on the market.
According to Erin Maigaard, President of the Lawrence Board of REALTORS®, “Lawrence buyers are seeing more choices than they had a year ago, but the additional inventory is concentrated in higher price ranges. Entry-level and workforce housing remain in critically short supply, continuing to place affordability pressure on first-time buyers and households seeking homes under $250,000. While the market is moving toward better balance, Lawrence remains well below the inventory levels typically associated with a balanced housing market.”
For questions and/or comments, please contact LBOR President Erin Maigaard at 785-764-5496 or EMaigaard@askMcGrew.com.
Complete statistical summaries for Lawrence and Douglas County are available at http://www.lawrencerealtor.com/market-statistics/.
Three-Year Comparison Through June 2026